New
Cockpit: your exposure, at a glance
New default landing page. All-time exposure, recent activity per scope, and the state of your monitors, all on one page.
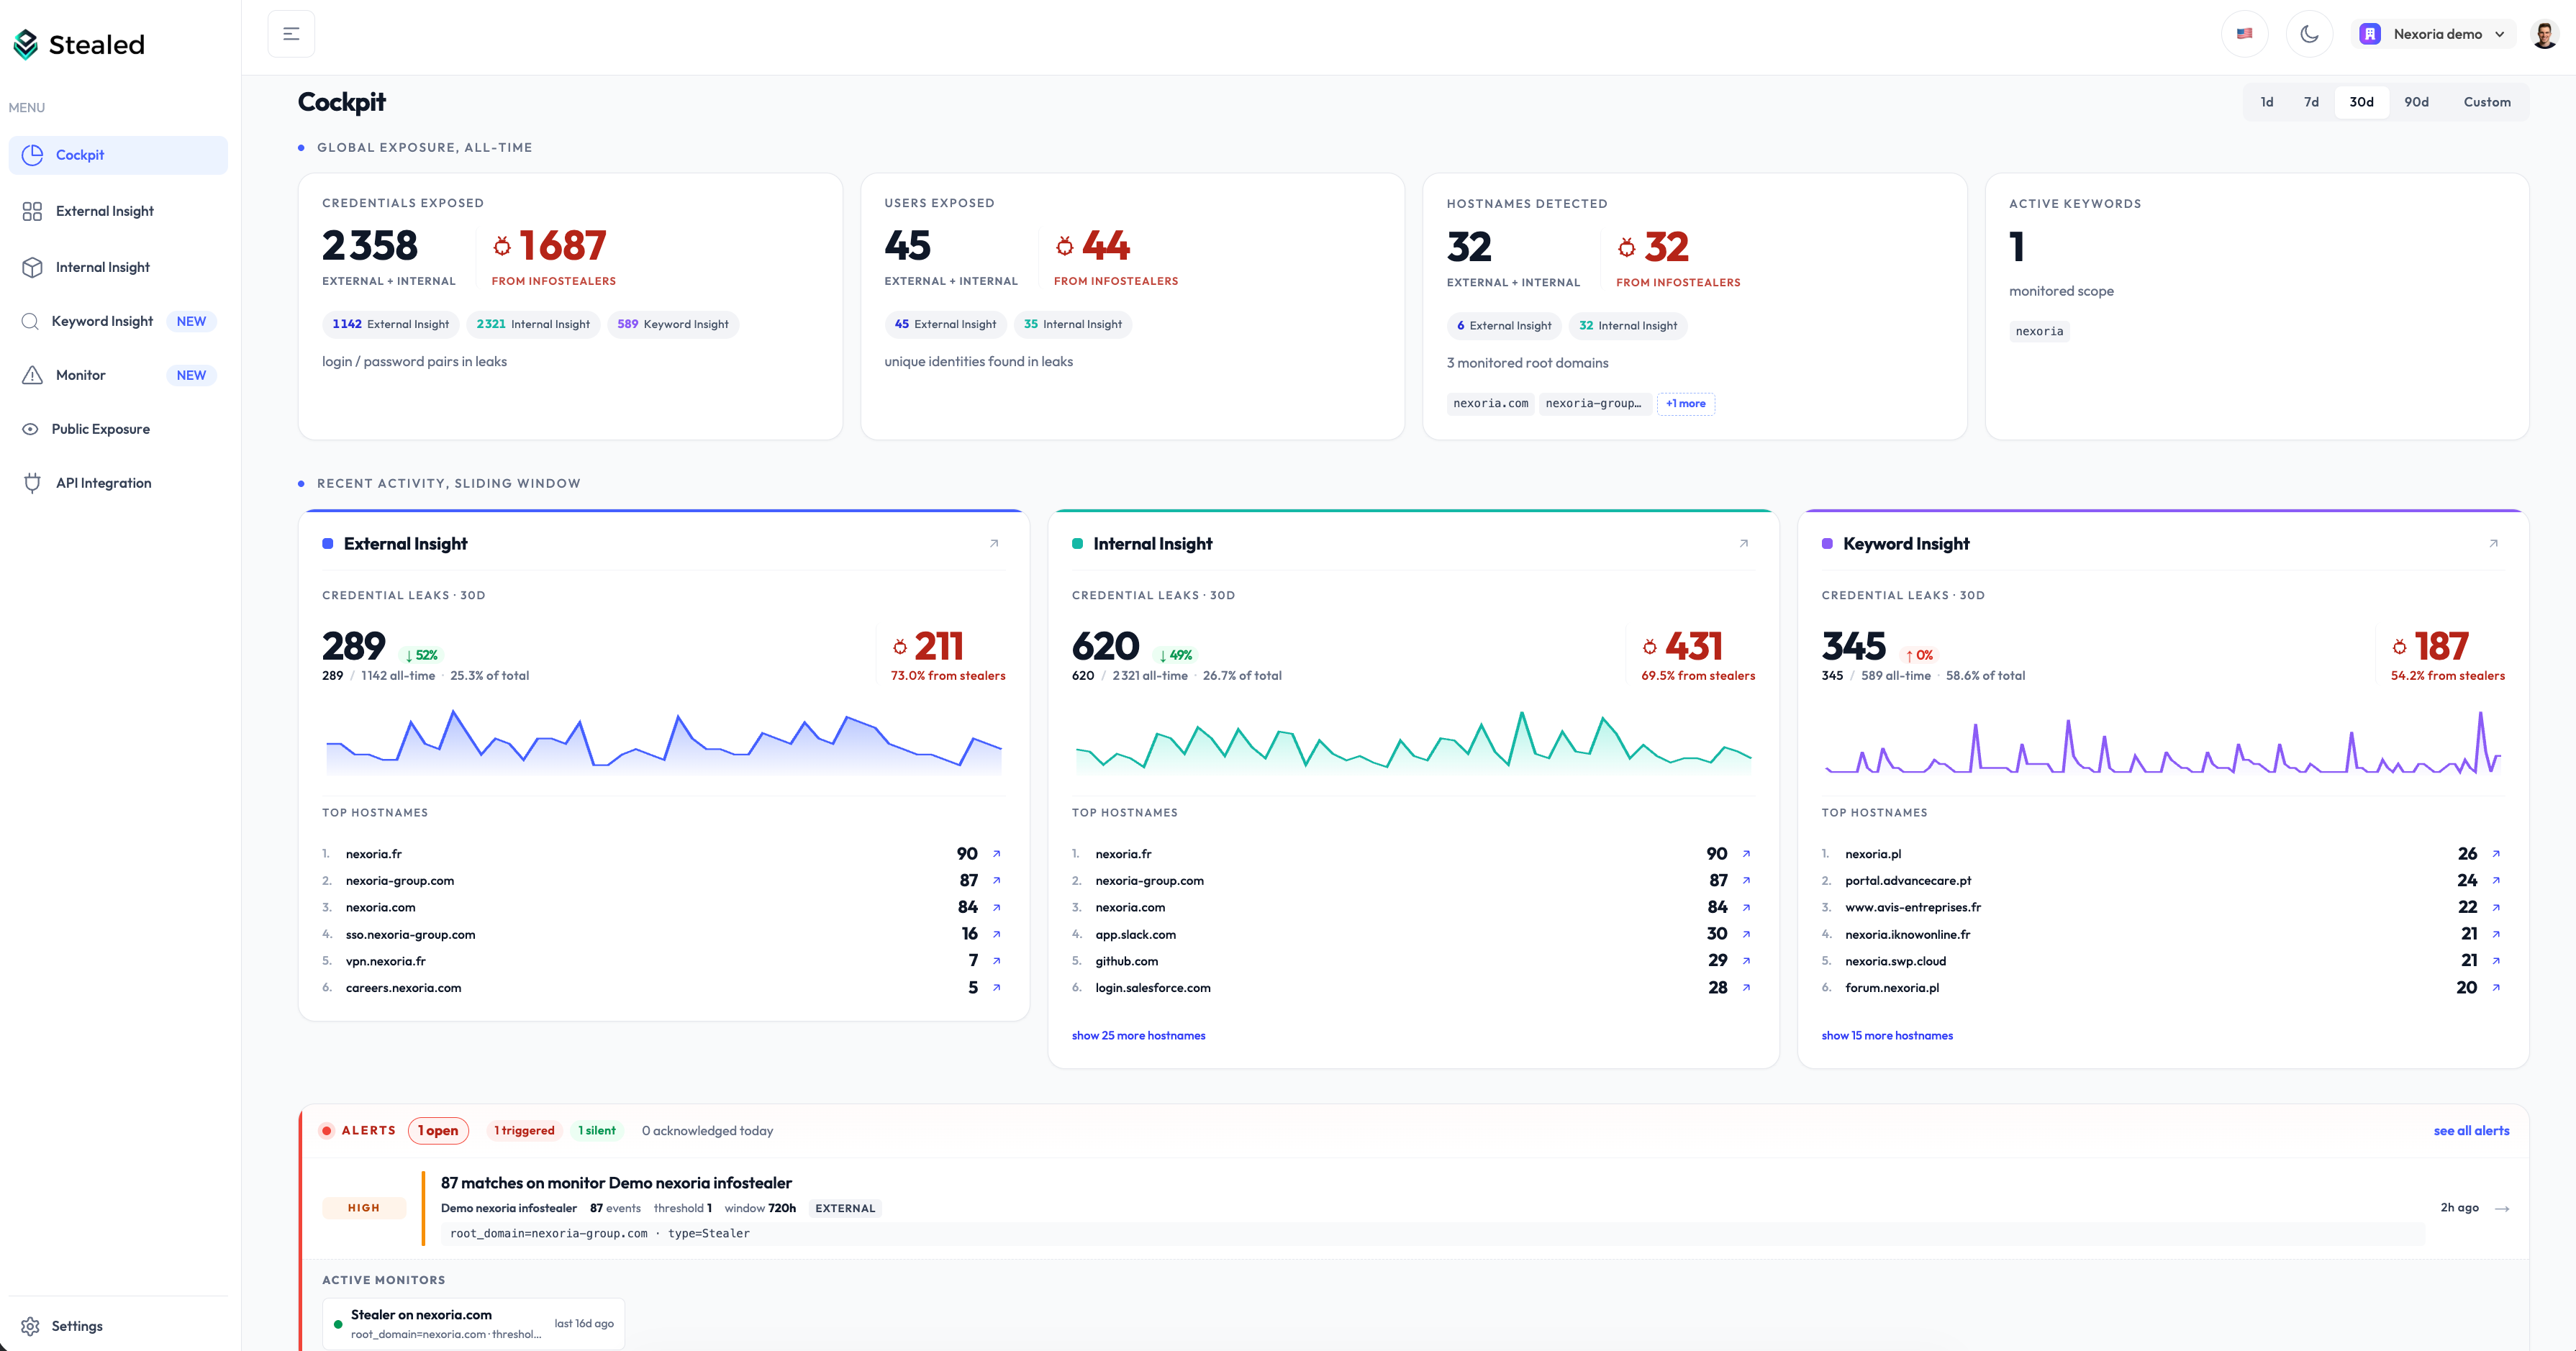
The Cockpit is now the page you land on after sign-in. One screen to answer “how exposed are we today, and what changed?” before diving anywhere else.
Three sections stacked top to bottom:
- Global Exposure, your all-time totals. Credentials, users and hostnames exposed, plus your monitored scope. Each number splits per Insight and isolates the infostealer-sourced leaks at a glance.
- Recent Activity, what changed in the last
1d,7d,30d,90dor a custom window. One column per Insight, with the trend versus the previous window and the Top hostnames hit during the period. - Alerts and Active Monitors, the live state of your monitoring. Triggered events, volumetric anomalies, and a grid of every monitor currently watching.
Every KPI, chip and Top item is clickable: drill straight into the leaks behind a number, or jump to the matching Insight pre-filtered. No more digging through three pages to figure out where the heat is.
Open the app, you are on it.